April 29, 2026
The Algorithm Reality Check: What Instagram, YouTube, and LinkedIn Actually Reward in 2026
There's a version of this blog post that would tell you to "post consistently, engage authentically, and know your audience." You've read that one. Many times.
This isn't that.
Because most creators and brands in 2026 are still operating on 2023 instincts. They're recycling content across platforms, padding videos to hit arbitrary length targets, and posting from company pages like it's still going to move the needle. Meanwhile, the platforms have quietly (and not so quietly) changed the rules entirely.
Let's us tell you what’s actually happening 👇
 Dwell time is the other signal that rarely gets discussed. Posts that keep users reading for 31-60 seconds achieve maximum distribution. This rewards substantive text posts, well-structured carousels, and document uploads over surface-level content. It also explains why posts with external links suffer. LinkedIn's algorithm applies a roughly 60% reach penalty to any post directing users off-platform, because the moment someone clicks away, dwell time ends.
How to measure dwell time?
Dwell time is the other signal that rarely gets discussed. Posts that keep users reading for 31-60 seconds achieve maximum distribution. This rewards substantive text posts, well-structured carousels, and document uploads over surface-level content. It also explains why posts with external links suffer. LinkedIn's algorithm applies a roughly 60% reach penalty to any post directing users off-platform, because the moment someone clicks away, dwell time ends.
How to measure dwell time?
Instagram 2026: The Platform That Rewards Conversations, Not Content
Instagram in 2026 has one obsession: distribution. Not just reach or views... distributable content. The kind people feel compelled to forward.Sends Per Reach Is the New North Star
If you're not tracking Sends Per Reach in your Instagram Insights right now, you're flying blind on the most important metric on the platform. When someone shares your Reel to a friend via DM, Instagram interprets that as the strongest possible endorsement - stronger than a like, save, or even a comment. Simple way to calculate that is: Sends per Reach = Total Sends ÷ Total Reach (Multiply by 100 if you want it as a percentage). Example: If a post reached 10,000 accounts and was sent (shared via DM) 800 times → 800 ÷ 10,000 = 0.08 or 8%Where to find the numbers
Both metrics are in Instagram's native insights: go to the post → tap View Insights → scroll to see Reach and Send (listed under interactions or shares depending on your account view).What's a good benchmark
Instagram hasn't published official benchmarks, but in practice:- 1–3% is average for most content
- 5%+ is strong — content people actively want to share with someone
- 10%+ is viral-territory for organic posts
The Aggregator Penalty Is Real and It's Brutal
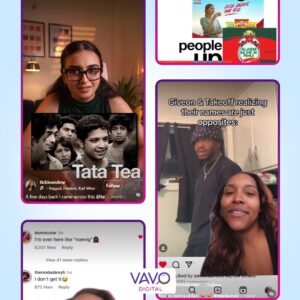
Instagram's 2026 algorithm now uses what's being called an "Originality Score" which is a system that actively detects and deprioritizes recycled content. If a creator reposts a clip from YT with a CapCut watermark still on it, Instagram doesn't just suppress the post, it often replaces the creator's version in recommendations with the original. The days of the aggregator account - the page that just reposts memes or clips and coasts on virality - are effectively over. For brands running influencer campaigns, this matters directly: don't send creators pre-edited brand assets and ask them to repost. That content starts with an algorithmic disadvantage before a single person has seen it. However, you can ask them to screen record the video and post a reaction content instead.
The Last-10-Seconds Problem Nobody Is Talking About
Everyone knows about hooks. The first three seconds, the scroll-stopping opener, the pattern interrupt - it's been beaten to death. What's being overlooked is the back end of a video. Data from multiple creator analyses in 2026 shows that Instagram now weighs what happens in the final seconds of a video almost as heavily as the opening. Pacing, storytelling, camera movement, and whether there's a genuine payoff - these are the signals that determine whether a viewer DMs the video to someone else or just scrolls past. A Reel that opens strong but loses momentum in the last ten seconds gets watched, not shared and in 2026, watched-but-not-shared is a poor result, as we discussed above.YouTube 2026: The Platform That Finally Stopped Rewarding Padding
For years, YouTube's watch time metric accidentally trained creators to stretch their videos. If longer equals more watch time, and more watch time means better rankings, then twenty minutes is always better than eight, right? That logic is now actively working against you.Satisfaction Has Overtaken Watch Time
The shift happened through late 2025 and has solidified in 2026: YouTube moved to what's being called satisfaction-weighted discovery. The algorithm now collects post-watch survey responses at scale, tracks replay behavior, session continuation (did the viewer keep watching YouTube after your video?), and comment sentiment. These satisfaction signals, taken together, now outweigh raw watch time as the primary ranking factor. What this means practically: a viewer who watches 100% of an eight-minute video and clicks like or drops a comment, sends a stronger signal than a viewer who watches 40% of a twenty-minute video and leaves. As one YouTube growth analyst put it after studying 500 million views across fifteen niches, YouTube now rewards positive termination - the viewer who gets exactly what they came for and leaves satisfied - more than the viewer who stayed longer but felt deceived by a clickbait title. Creators who trimmed their videos from fifteen minutes down to eight started seeing more reach, not less. The platform has finally caught up to what audiences actually wanted."Not Interested" Is Quietly Destroying Channel Performance
There’s a signal that doesn't show up in most creator audits: negative feedback. Every time a viewer clicks "Not Interested" or "Don't Recommend Channel" on your video, YouTube applies significant negative weight to that video's distribution and it doesn't just affect that video in isolation. The YouTube algorithm is a pattern-recognition machine. A channel that repeatedly earns "Not Interested" clicks from a certain audience cohort will gradually stop being recommended to that cohort entirely. The damage builds quietly - you won't see a single dramatic drop, just a slow erosion of reach across the channel that's very hard to reverse. The most common cause isn't bad content. It's mismatched expectations like titles and thumbnails that promise something the video doesn't deliver. High CTR followed by steep drop-off and negative feedback is, according to multiple creator strategists, one of the fastest ways to tank long-term channel health.LinkedIn 2026: Company Pages Are Effectively Dead Organically
This one needs to be said directly, because a lot of marketing teams are still investing significant resources into LinkedIn company pages that are now algorithmically invisible.The Numbers Are Clear
Organic reach for company pages on LinkedIn dropped 60-66% between 2024 and early 2026. According to the Algorithm InSights 2025 Report, which analyzed 1.8 million posts, company pages now reach approximately 1.6% of their followers. Content from company pages accounts for roughly 1-2% of the entire LinkedIn feed are down from 7% in 2021. Meanwhile, personal profiles now dominate 65% of content consumption on the platform and generate 561% more reach than company pages sharing the same content. A Refine Labs study found that employee posts generated 2.75x more impressions and 5x more engagement than the company page, despite employees having 46% fewer followers. The algorithm has made its preferences clear: it wants people, not logos.The Hidden Ranking Signals: Saves and Dwell Time
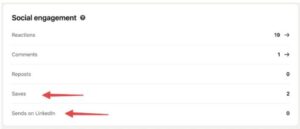
LinkedIn quietly added Saves and Sends to post analytics in late 2025. That wasn't a minor product update - it was the algorithm team flagging exactly what they're now measuring. Saves are currently the most valuable engagement signal on LinkedIn, valued roughly five times more than a standard like. They indicate that someone found your content reference-worthy enough to return to, which is high-intent behavior on a professional network.
Dwell time is the other signal that rarely gets discussed. Posts that keep users reading for 31-60 seconds achieve maximum distribution. This rewards substantive text posts, well-structured carousels, and document uploads over surface-level content. It also explains why posts with external links suffer. LinkedIn's algorithm applies a roughly 60% reach penalty to any post directing users off-platform, because the moment someone clicks away, dwell time ends.
How to measure dwell time?
- LinkedIn Ads (Campaign Manager): Use the "Engagement" or "Video" column view to find the "Average Dwell Time" metric, which calculates the average time in seconds.
- Organic Posts (Proxy Metrics): Since LinkedIn doesn't provide public analytics for organic dwell time, you can infer it via:
- "See More" Clicks: Higher click-through rates suggest users are staying to read more.
- Comment Depth: Long, thoughtful comments suggest users spent time consuming the post.
- Scroll Speed: If users pause in the feed, they are "dwelling"
The Cross-Platform Mistake That's Costing You Reach
We see multiple brands or creators develop a content idea, shoot one video or write one post, and distribute the same asset - sometimes verbatim, sometimes with minor resizing - across Instagram, YouTube, and LinkedIn. The problem isn't the idea. The problem is that each platform has a fundamentally different content structure that the algorithm rewards.- Instagram in 2026 rewards content structured around a DM-able moment - something emotionally resonant or practically useful enough that a viewer wants to immediately send it to someone specific. The optimization question is "who is this for and why would they forward it?"
- YouTube rewards content structured around a satisfying answer - a clear promise in the title, a tight delivery, and a genuine payoff that makes the viewer feel the watch was worth it. The optimization question is "did the viewer leave satisfied?"
- LinkedIn rewards content structured around professional insight - substantive enough to earn a save, specific enough to generate real comments, and native enough to keep the reader on-platform. The optimization question is "would someone come back to this?"
VAVO's Verdict: Platform Priority by Category in 2026
Based on campaign performance data across categories, here's where we're seeing the strongest ROI by content type:- Beauty:Instagram remains the primary platform - the visual-first nature of the category makes it the highest-conversion channel. When we at VAVO design content strategy for beauty campaigns, we build the storyline and messaging to naturally push for that "send this to a friend" moment, like product reveals with a cliffhanger, tutorials with a relatable problem, or "which shade are you?" formats that make people want to loop someone in. YouTube is strong for long-form review content where search intent is high (e.g. "is [product] worth it"). LinkedIn is a distant third unless the brand is pitching retail buyers or investors..
- Finance: LinkedIn first, no contest. Finance content that demonstrates genuine expertise - market commentary, personal finance frameworks, founder perspectives - earns saves and dwell time at rates we don't see in other categories. YouTube works well for explainer content targeting specific search queries. Instagram can work for personal finance creators targeting younger audiences, but the depth of engagement is lower.
- Food: Instagram and YouTube are neck-and-neck, and the choice depends on format. Short-form recipe content and food aesthetics perform exceptionally well on Instagram Reels, where the DM share mechanic activates strongly ("I need to try this, sending to my group chat"). YouTube works better for longer cooking content, regional cuisine exploration, and anything where the viewer needs actual instruction rather than inspiration.
- Lifestyle: Instagram is still the dominant platform for lifestyle creators, but the key variable is whether the creator's content earns DMs or just views. Lifestyle content that triggers "this reminded me of you" shares compounds over time. Content that's just aesthetically nice but not specifically sendable plateaus quickly.
- Tech: YouTube is the clear primary platform for tech - search intent is high, the audience expects substance over style, and the satisfaction signal mechanic works in favor of creators who deliver genuinely useful explainers or reviews. LinkedIn is strong for B2B tech and SaaS brands targeting decision-makers. Instagram works for consumer tech launches but rarely as the primary conversion channel.