Instagram Analytics: 5 Metrics You Need to Understand
Instagram is no more a people's village. It is a huge marketplace with brands and startups willing to spend money on advertisements for the sake of attracting an audience.
Going to the analytics, Instagram now brags a family of 2 billion monthly active users and over 400 million stories being posted every day. The craze to imitate celebrities and brand ambassadors is beyond limitations. People like to buy what their favourite icons are endorsing. Hence marketing agencies are willing to liberally spend millions on ads and creative content to reach out to customers.
We won't know how much a student has learned until we analyse their report cards. Similarly, marketing teams need to go through their social media presence on Instagram and analyse the activities that have taken place, to clarify the successes and failures. Without this, it may be difficult to choose the right strategy for forthcoming events. You can check out 5 big influencer marketing trends to look out for in 2023.
Instagram insights are available for all business account pages. The three prime insights sections that Instagram gives to the user are Total followers, Accounts reached, and Accounts engaged during the week. You can use Sehaye to uplift your influencer marketing campaigns easily by collaborating smoothly.
Here in this article, we will talk about how important Instagram analytics work and which are the most crucial ones. So let's roll, camera, and action!
- Engagement Rates
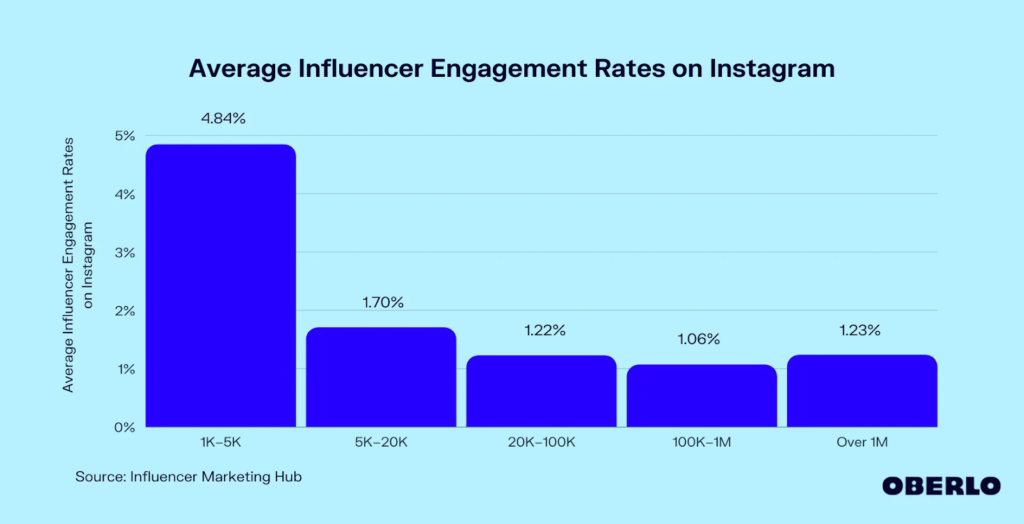
Credits: Oberlo
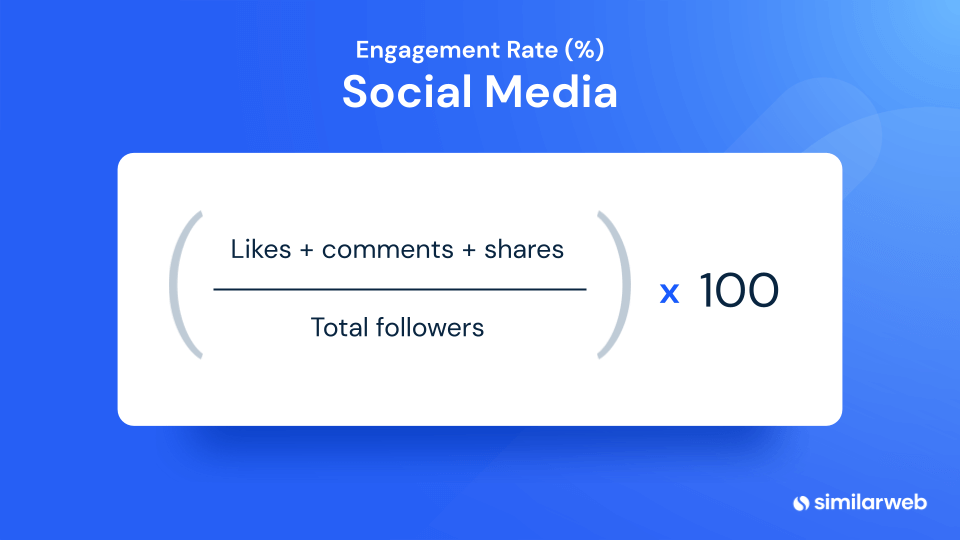
If you are willing to know where to start analysing, engagement rate should be your priority. It tells how many likes, shares, comments, and saves your posts get once they get posted. Having good engagement ensures that your posts appear more on the feeds of accounts you have been targeting.
As content is king, engagement is the throne. Instagram runs on the business of audience interaction with several brands and their content. So optimistic contents always get the limelight. You can view the total engagement on the content tab of your Instagram insights.
On the other hand, the engagement rate holds a better place in terms of audience interaction than just engagement. As you can see, calculating the engagement rate is quite easy because it's not shown directly in insights.
A post with low engagement can have a very high engagement rate.
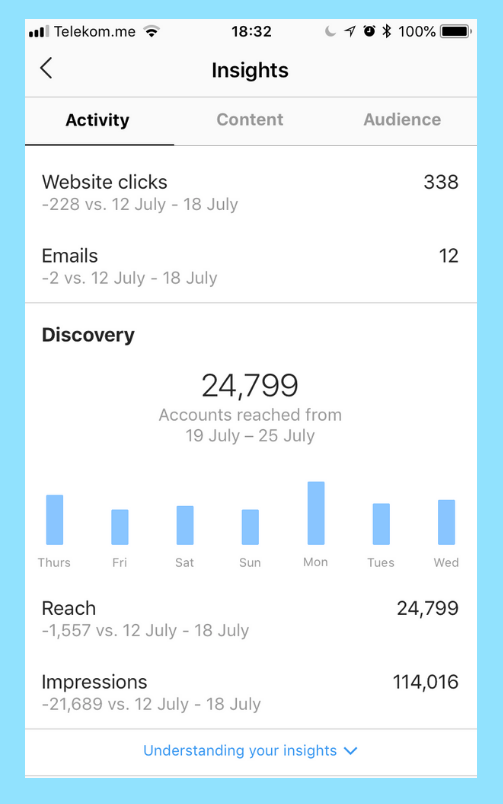
- Audience Reach
Reach can be viewed in the activity tabs of your insights. Per week, per day, and post reach is shown in this. You must not be confused with reach and impressions.
Reach tells about the number of unique clicks or views of your content per day or week. While impressions are counted every time any account views your account. This means reach increases only once per account while this doesn't hold for impressions. One account can have more than one impression. Hence impressions don't impact much on the success of your content.
A good reach means; you have been posting accurately by your niche, at the right time, and right day, with the correct hashtags and tags.
- Profile Views
As the name suggests, if you are a brand and looking for actual sales through the Instagram community then website clicks per profile becomes an important metric. Add the CTA-like link in the bio below every post so that you get conversions. A lot of website clicks can be analysed using google analytics tools. More clicks, means you have been driving a huge crowd to visit your profile and check out your products.
- Audience Demographics
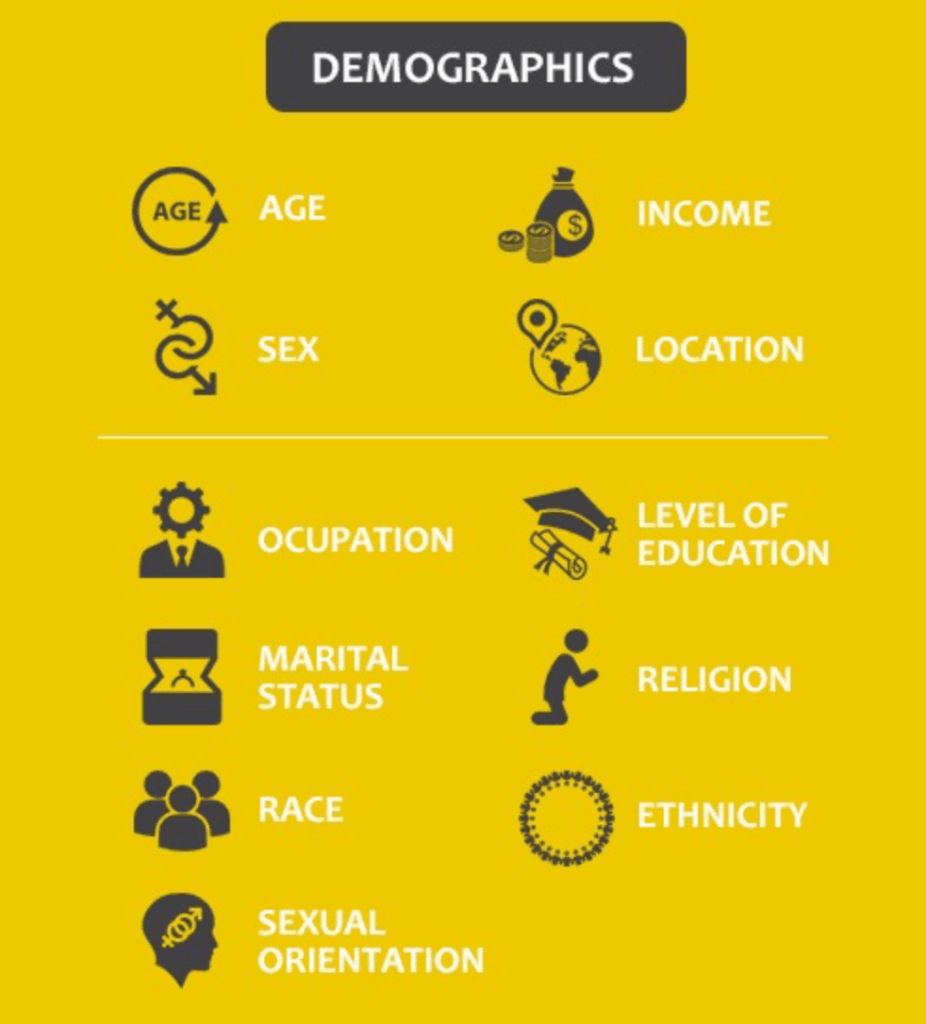
Credits: CoSchedule
Audience demographics help to decide whether your content has been appealing to your target audience or not. A massage belt for the old age group should not be targeting teenagers. If your audience demographics don't show more old age people, then you need to replace your strategies.
- Follower Growth
As such follower growth rate is not shown in the Instagram insights tab. But you can keep track of follower track on a per-week or per-month basis and then calculate the percentage. If the trend of percentage is positive and increasing every month, then you are on the right path and your measures have turned fruitful.
Conclusion
We hope we were able to solve your midnight worries about the Instagram ads business and Instagram analytics. There are pros and cons related to each field. But one of them must work miracles for you surely.
Vavo Digital hosts a widespread platform for businesses and brands to look for the right content creator. We also work on Instagram analytics and serve as the best companion for contemplating Instagram metrics. We have partnered with brands like Netflix and Nykaa and hope to collaborate more and more!
Still, confused under the piles of analytics and don't know where to start? Contact us through our email, hello@vavodigital.com and our team will get back to you in no time.